Slow Jazz for Crickets? Noise Pollution and Cricket Courtship Behavior
*These authors wrote this paper for Neuroscience 340: Animal Physiology taught by Dr. Margot A. B. Schwalbe.
Introduction:
Communication and courtship between crickets are most attributed to chirping. However, only male Acheta domesticus crickets can chirp, which is produced when they rub the plectrum of one wing on the file of the other (Pollack, 2014). Chirps vary in frequency from 2 to 8 kHz depending on the species (Kostarakos & Romer, 2010). Both males and females have a tympanal membrane on their front legs that functions as a hearing organ to pick up chirping sounds (Figure 1,2). This membrane is selective to frequencies of chirps that match those of their own species, which are amplified by the membrane more than other sounds (Pollack, 2014).
There are four common courtship behaviors observed in crickets: chirping, tremulation, rearing, and side-by-side orientation; chirping is the most common behavior by males and produces sounds necessary for females to initiate mating (Nelson & Nollen, 1997). Tribulation involves body wiggling, assisting in communication and physical signaling between crickets (Broder et al., 2021). Rearing is an aggressive behavior males perform to assert dominance amongst other crickets (Alexander, 1961). Side-to-side orientation, or turns, places the male abdomen in an optimal orientation for the female to mount and begin mating (Adamo & Hoy, 1994). Noise pollution can disrupt courtship behaviors (Walker, 2020).
Human noise pollution has increased with industrial advances in major population centers (Ditmer et al., 2021). Additionally, human innovation rapidly changes the environment, leaving little time for animals to acclimate (Bent et al., 2021). Traffic is responsible for much noise pollution emitted by humans, which produces sound at a range of 70-75 decibels and various frequencies (Bent et al., 2021). Increases in noise pollution can interfere with the behavior of animals, such as crickets, that rely on sound cues to find mates (Bent et al., 2021).
This experiment aims to quantify the effect of noise pollution by studying how high- and low-frequency sounds at 70 dB impact the courtship behaviors of Acheta domesticus crickets. Each behavior will be tested in various noise frequency conditions to determine if sound impacts courtship behavior regularity. It is predicted that the low-frequency sound condition will most interfere with courtship behaviors as it overlaps the frequency of mating call chirps produced by male crickets. It is hypothesized that this will lead to lower average time of behavior performances for crickets in low-frequency conditions compared to other conditions.
Methods:
The Acheta domesticus study species was acquired from Petco after the original shipping methods were delayed. All of the crickets were of an undeterminable age and virginity status. Male and female crickets were manually sexed by determining the presence of an ovipositor on the distal portion of the female abdomen or the absence of an ovipositor for the males. Once sorted, male and female crickets were kept in separate containers in a warm, dark, dry room with constant access to food and water. The crickets were allowed three days to acclimate to the environment before trials began. Trails were run from April 1st through April 11th, 2024. The room was dark, and an automatic lamp was turned off from 11 am to 5 pm to align their ‘nighttime’ active periods with the experimental dark room time frame. Crickets are usually most active for mating at night, but this dark lighting schedule in the study room during daylight hours allowed for the cricket’s sleep and activity schedules to match our own. Two audio files were made, one at low frequency (5-10 kHz) and one at high frequency (15-25 kHz). Four plastic containers with a mesh open window were made and aligned at an equal distance from the speaker, with the mesh window facing the speakers. To ensure that the sound was at 70 dB in the containers, sound levels were measured with a sound level meter provided by the Biology Department. Personal phones were placed behind the containers, and a red lamp was turned on to make the recording visible to us (Figure 8). The red light does not affect the crickets. Before each trial, one male and one female were added to each container. Once all cricket pairs were in the containers, the timer and the videos began. Each trial was run for one hour, with the male and female being monitored for courtship behaviors. The room was kept at 25-28 degrees Celsius during each trial. Behaviors were analyzed by physically watching the trials as they were run and again later by watching the video recording after each trial to determine the amount of time that each behavior was performed. After the hour, the males and females were placed back into individual containers with crickets of their sex. Twelve total trials were run: 4 control trials with no sound, four with low-frequency sound, and four with high-frequency sound. Each trial included four cricket pairs and four containers.
Once trials were completed, the crickets were placed in a freezer for 24 hours to ensure ethical euthanization. We then used a dissecting microscope attached to a computer with CaptaVision+ software to produce a microscopic image of the cricket tympanal membrane. The female nymph was imaged at 20X magnification level, and the male adult was imaged at 40X.
Once microscopic imaging was done, all crickets were adequately disposed of. Data was formulated in an Excel Spreadsheet. For each behavior and each trial, the time spent performing each courtship behavior was entered into the Excel sheet. The data was graphed using average times, and statistical analysis was completed using One-way single-factor ANOVA. The independent variable in this study was the sound frequency, and the dependent variable was the amount of time spent performing each courtship behavior.
Results:
For the imaging of the tympanal membrane in Figure 1, the female nymph contains a tympanal membrane visible in the middle of its foreleg. It can be seen as a small ovular structure at a 20X magnification level. The membrane is lighter in color than the surrounding exoskeleton pigment and features no hair. It has a reflective, shining quality to it that is not found anywhere else on the body or limbs. Although not pictured in Figure 1, a similar tympanal membrane is featured on the opposite foreleg. Figure 2 shows an almost identical, albeit larger, tympanal membrane on the adult male cricket at a 40X magnification level. Like the female nymph, the membrane is ovular, lighter, and more reflective than the surrounding pigment. Like the female, it has another tympanal membrane on the other foreleg. The main difference between the male and female membrane is the size difference due to the female being a young nymph and the male being a fully-grown adult.
Starting with chirping data, Figure 3 represents the average number of chirps produced by the male crickets in each trial for each sound frequency condition. The control group is represented in gray, the low-frequency sound group is blue, and the high-frequency sound group is yellow. The average amount of chirping behavior is represented on the y-axis and the sound frequency condition is on the x-axis. Since the cricket chirps are so short and not prolonged for multiple seconds, chirps were measured with the average number of chirps performed for each condition rather than the average time spent performing the behavior, as shown in Figure 4-6. In Figure 3, the control sound condition produced a higher average number of chirps per trial at 0.75 chirps per trial, with the low condition producing 0, and high producing 0.25 chirps per trial. The standard deviation of the control condition was 1.6 and for high it was 0.62. A P-value of 0.19 indicates that the difference in average number of chirps between each condition is not statistically significant, and no definitive conclusions can be taken from this figure in terms of how each sound condition impacts the amount of chirping in our crickets.
For tremulation data in Figure 4, this figure represents the average time spent tremulating per trial for each of the sound frequency conditions. All frequency conditions are represented in the same colors as Figure 3. The average time performing tremulating behavior is represented on the y-axis and the sound frequency condition is on the x-axis. Here, the control sound condition produced the lowest average time spent tremulating at 302.8 seconds per trial, with the low condition producing 353.0 seconds per trial, and the high condition producing the highest value at 414.8 seconds per trial. The standard deviation of the control condition was 268, for low it was 117, and for high it was 410. Like Figure 3, a P-value of 0.85 indicates that the difference in average time spent tremulating per trial between each condition is not statistically significant, and no definitive conclusions can be taken from this figure in terms of how each sound condition impacts the length of time that our crickets spent tremulating.
For rearing data in Figure 5, this figure represents the average time spent rearing per trial for each of the sound frequency conditions. All frequency conditions are represented in the same colors as Figures 3 and 4. The average time performing rearing behavior is represented on the y-axis and the sound frequency condition is on the x-axis. Here, the control sound condition produced the highest average time spent rearing at 367.3 seconds per trial, while the low condition produced the lowest value at 91.8 seconds per trial and the high condition produced the medium value at 327.3 seconds per trial. The standard deviation of the control condition was 179, for low it was 115, and for high it was 240. Like Figures 3 and 4, a P-value of 0.13 indicates that the difference in average time spent rearing per trial between each condition is not statistically significant, and no definitive conclusions can be taken from this figure in terms of how each sound condition impacts the length of time that our crickets spent rearing.
For side-by-side data, Figure 6 represents the average time spent in side-by-side orientation per trial for each of the sound frequency conditions. Here, the control sound condition produced the highest average time spent side-by-side at 367.1 seconds per trial, while the low condition produced 230.6 seconds per trial and the high condition produced the lowest value at 103.5 seconds per trial. The standard deviation of the control condition was 255, for low it was 64, and for high it was 103. Like the others, a P-value of 0.18 indicates that the difference in average time spent in side-by-side orientation per trial between each condition is not statistically significant, and no definitive conclusions can be taken from this figure in terms of how each sound condition impacts the length of time that our crickets spent side-by-side.
Although not tested by statistics, Figure 7 is a supplemental figure that represents the number of times that each courtship behavior was performed in all trials overall. Each of the four behaviors is listed with the number of times the behavior was performed overall on the y-axis and the sound condition on the x-axis. Side-by-side orientation and tremulation were the behaviors that were performed the most, with chirping as the least. For each behavior, the control condition had crickets that performed the most of that given behavior, with the low sound frequency group producing the fewest number of behaviors. The high sound condition for each behavior was in the middle of the control and low groups in terms of behavior amount. This result of lower behavior amounts in the low condition would support our initial hypothesis that the low sound frequency would overlap with cricket courtship communication frequencies, but since Figure 7 is only a representation of the amount of each behavior and could not be tested with ANOVA due to not having means to compare, the conclusions that can be gleaned from this data are minimal and cannot be statistically confirmed.
Based on Figures 3, 4, 5, and 6, the control sound condition generally showed a longer average/higher average amount of behaviors than the other groups, with the low sound frequency group showing a shorter average/lower average amount of behaviors, similar to the trend in Figure 7. However, since Figures 3, 4, 5, and 6 contain data sets that are not statistically significant, this conclusion cannot be reasoned, and no major conclusions regarding the length of courtship behavior and noise frequency can be determined from this experiment’s data.
Discussion:
This research is inconsistent with previous studies and does not support the hypothesis. No significant differences were found between cricket courtship behaviors subjected to different noise frequencies. However, it is essential to note the only experimental group where no chirping was recorded was the low-frequency group, which was predicted to interfere with cricket courtship behaviors. Although not statistically significant, these trends were interesting to compare to previous research.
Studies suggest species that rely on acoustic communication are particularly vulnerable to noise pollution, with crickets reducing mating and courtship behavior in white noise conditions mimicking traffic (Bent et al., 2021). Further, male crickets chirp less when closer to busy roads compared to ones in rural habitats (Gallego-Abenza et al., 2019). Noise pollution also causes females to produce smaller offspring that develop into smaller adults than crickets grown without such noise (Rebar et al., 2022). Interestingly, we didn’t find corroborating results in our study.
Major limitations of this study include sample size and acquisition of crickets. Due to delays, crickets were purchased at Petco and had deformed extremities. They were also purchased in a mixed-sex container with no way to determine their exact age or whether they were virgins. Many crickets also died, which necessitated the reuse of crickets for multiple trials. This could have impacted results.
Recognizing the impacts of noise pollution on wildlife is crucial for conservation management. Noise pollution can cause crickets to fail in locating mates or detecting predation signals. Over time, this can reduce reproductive success, ultimately contributing to biodiversity loss (Rebar et al., 2022). Identifying areas of high noise exposure and understanding its effects on animals allows conservationists to implement measures to mitigate noise impacts. This may include reducing noise emissions from humans, forming noise barriers/buffers, and preserving acoustic refuges where natural sound remains undisturbed. Governments have already established noise standards and guidelines to limit noise emissions from various sources, such as transportation, industry, and construction (EPA, 2023).
Potential future studies include expanding the study to include high and low decibel values to observe the decibel impact on cricket courtship behavior. Additional studies can be conducted to see how sound frequencies affect male aggression and dominant behaviors. Overall, the initial hypothesis could not be supported by the inconclusive results produced by this study, but future research should continue studying how noise pollution variables impact sound-signaling animals since this experiment was not able to contribute to the larger field of study.
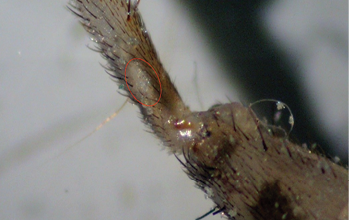
Figure 1: A close-up view of the tympanal membrane in an Acheta domesticus female nymph on its front legs at 20x magnification. The membrane is absent of hair and takes a reflective sheen. The entirety of the tympanal membrane is circled in red in the figure.
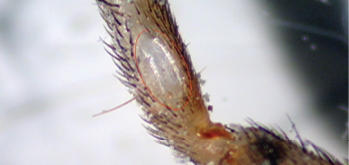
Figure 2: A close-up view of the tympanal membrane in an Acheta domesticus adult male on its front legs at 40x magnification. The membrane is absent of hair and takes a reflective sheen. The entirety of the tympanal membrane is circled in red on the figure.
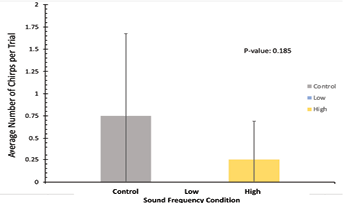 Figure 3: Average number of chirps across all trials for all experimental noise groups. The control sound group is depicted in grey, the low-frequency sound group is depicted in blue, and the high-frequency sound group is depicted in yellow. The mean number of chirps in each condition on the y-axis and sound frequency conditions on the x-axis. Standard deviation error bars are included on top of each data bar. P-value = 0.18, indicating non-significance of chirping difference between conditions.
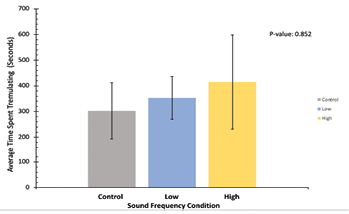
Figure 4: Average time spent tremulating, in seconds, across all trials for all experimental noise groups. The control sound group is depicted in grey, the low-frequency sound group is depicted in blue, and the high-frequency sound group is depicted in yellow. The mean time spent tremulating in each condition is represented on the y-axis and the sound frequency conditions of the x-axis. Standard deviation error bars included on top of each data bar. P-value = 0.85, indicating non-significance of behavioral time difference between conditions.
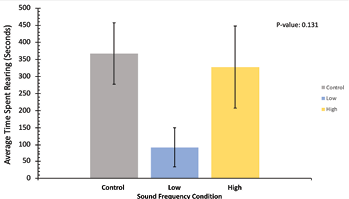 Figure 5: Average time spent rearing, in seconds, across all trials for all experimental noise groups. The control sound group is depicted in grey, the low-frequency sound group is depicted in blue, and the high-frequency sound group is depicted in yellow. The mean time spent rearing in each condition is represented on the y-axis, and sound frequency conditions on the x-axis. Standard deviation error bars are included on top of each data bar. P-value = 0.13, indicating non-significance of behavioral time difference between conditions.
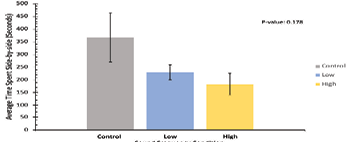
Figure 6: Average time spent oriented side-by-side, in seconds, across all trials for all experimental noise groups. The control sound group is depicted in grey, the low-frequency sound group is depicted in blue, and the high-frequency sound group is depicted in yellow. Mean time spent side-by-side in each trial is represented on the y-axis and sound frequency conditions on the x-axis. Standard deviation error bars are included on top of each data bar. P-value = 0.18, indicating non-significance of behavioral time difference between conditions.
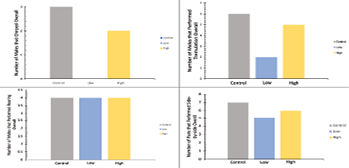
Bonus Figure 7: Number of total courtship behaviors displayed by crickets in each experimental noise group during all trials. Number of chirps in the top left, the number of tremulations in the top right, the number of rearings in the bottom left, and the number of side-by-side orientations in the bottom right. Control, low, and high sound frequency conditions are displayed as they were in Figures 3-6.
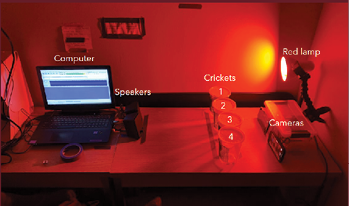
Bonus Figure 8: Experimental setup for each trial run for an hour. Tape marks on the table indicated where to place each variable and were used to keep trials consistent. All materials used are labeled in the figure. Red lamps are set up for our viewing and have no significance for crickets.
Note: Eukaryon is published by students at Lake Forest College, who are solely responsible for its content. The views expressed in Eukaryon do not necessarily reflect those of the College. Articles published within Eukaryon should not be cited in bibliographies. Material contained herein should be treated as personal communication and should be cited as such only with the consent of the author.
References
Adamo, S. A., & Hoy, R. R. (1994). Mating behavior of the field cricket gryllus bimaculatus and its dependence on social and environmental cues. Animal Behaviour, 47(4), 857–868. https://doi.org/10.1006/anbe.1994.1117
Alexander, R. D. (1961). Aggressiveness, territoriality, and sexual behavior in field crickets (orthoptera: Gryllidae). Behaviour, 17(2–3), 130–223. https://doi.org/10.1163/156853961x00042
Bent, A. M., Ings, T. C., & Mowles, S. L. (2021). Does anthropogenic noise affect the acoustic courtship interactions of Gryllus bimaculatus? Animal Behaviour, 174, 9–19. https://doi.org/10.1016/j.anbehav.2021.01.013
Broder, E. D., Wikle, A. W., Gallagher, J. H., & Tinghitella, R. M. (2021). Substrate-borne vibration in Pacific Field Cricket Courtship displays. Journal of Orthoptera Research, 30(1), 43–50. https://doi.org/10.3897/jor.30.47778
Ditmer, M. A., Francis, C. D., Barber, J. R., Stoner, D., Seymoure, B., Fristrup, K. M., & Carter, N. (2021). Light and noise pollution impacts specialist wildlife species disproportionately. bioRxiv (Cold Spring Harbor Laboratory). https://doi.org/10.1101/2021.02.18.431905
EPA. (2023, August 8). Clean Air Act Title IV - Noise Pollution. https://www.epa.gov/clean-air-act-overview/clean-air-act-title-iv-noise-pollution#
Kostarakos, K., & Römer, H. (2010). Sound transmission and directional hearing in field crickets: Neurophysiological studies outdoors. Journal of Comparative Physiology A, 196(9), 669–681. https://doi.org/10.1007/s00359-010-0557-x
Nelson, C. M., & Nolen, T. G. (1997). Courtship song, male agonistic encounters, and female mate choice in the house cricket, Acheta Domesticus (Orthoptera: Gryllidae). Journal of Insect Behavior, 10(4), 557–570. https://doi.org/10.1007/bf02765377
Pollack, G. (2014). Cricket Acoustic Communication. Scholarpedia, 9(2). https://doi.org/10.4249/scholarpedia.11999
Walker, Thomas J. house cricket - Acheta domesticus (Linnaeus). (2020). https://entnemdept.ufl.edu/creatures/misc/crickets/adomest.html
Note: Eukaryon is published by students at Lake Forest College, who are solely responsible for its content. The views expressed in Eukaryon do not necessarily reflect those of the College. Articles published within Eukaryon should not be cited in bibliographies. Material contained herein should be treated as personal communication and should be cited as such only with the consent of the author.

